This is a summary of a YouGov/Economist Poll conducted July 23-24, 2016. The sample is 1300 general population respondents with a Margin of Error of ±4.2% (4.5% for registered voters).
GENERAL ELECTION (among registered voters):
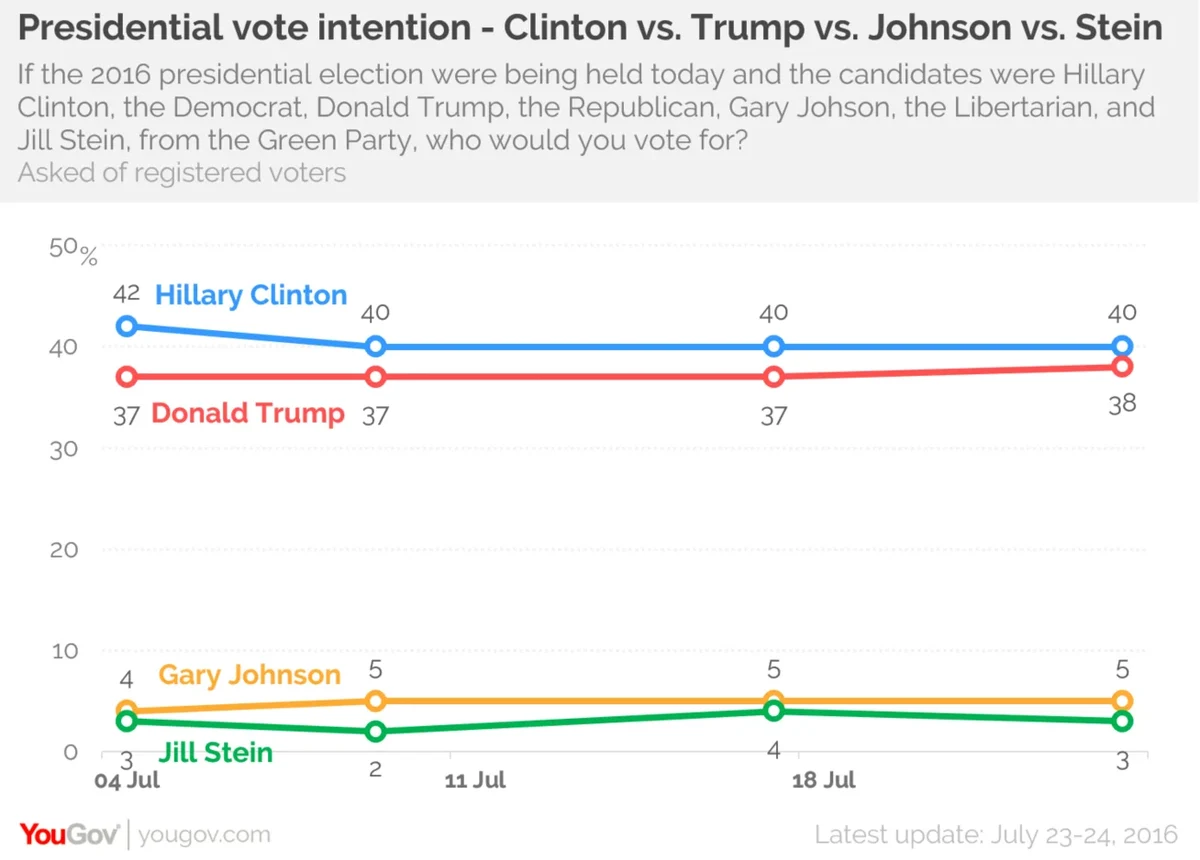
If the 2016 presidential election were being held today and the candidates were Hillary Clinton, the Democrat, Donald Trump, the Republican, Gary Johson, the Libertarian, and Jill Stein, from the Green Party, who would you vote for?
- Hillary Clinton: 40% (0)
- Donald Trump: 38% (+1)
- Gary Johnson: 5% (0)
- Jill Stein: 3% (-1)
- Someone else: 5%
- Not sure yet: 7%
- Probably won't vote: 2%
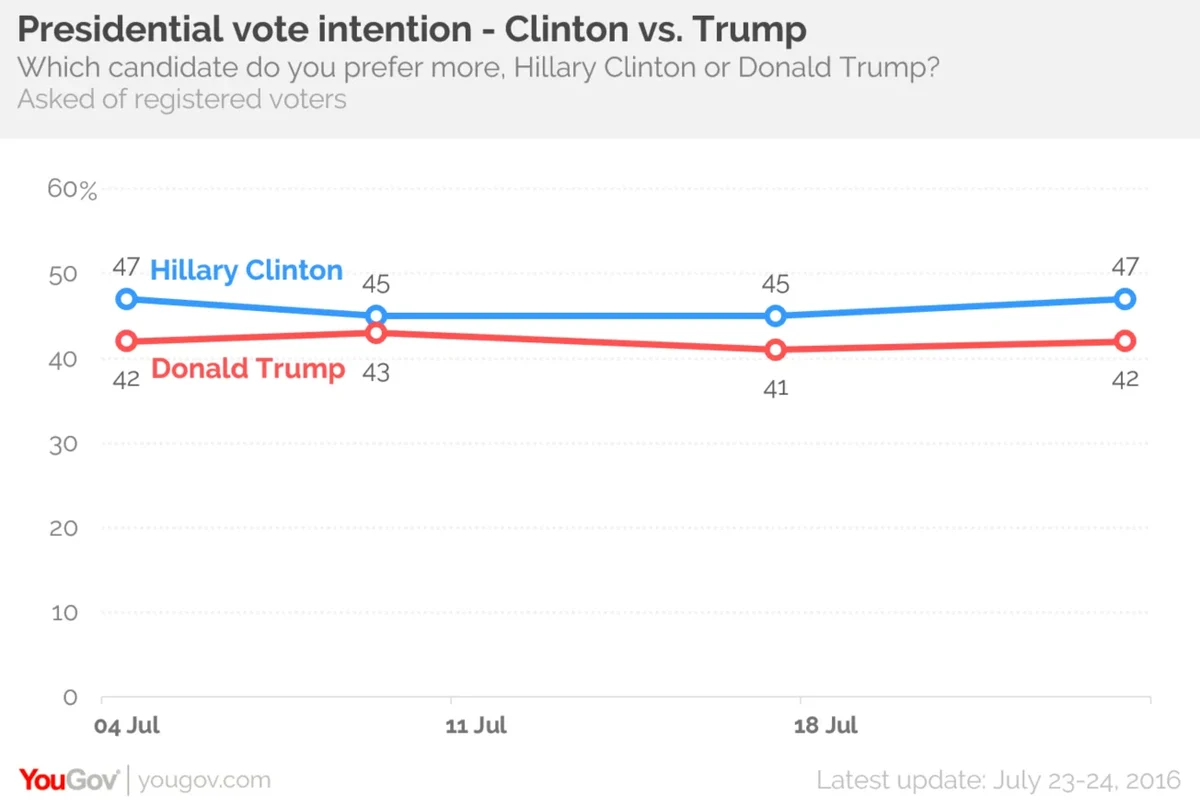
2-way follow-up: Respondents who selected Gary Johnson, Jill Stein, or ’someone else’ were asked the following question ’Which candidate do you prefer more, Hillary Clinton or Donald Trump?’ Below those responses have been added to the support for Clinton and Trump from the initial question.
- Hillary Clinton: 47% (+2)
- Donald Trump: 42% (+1)
- Someone else / Not sure yet / No preference: 9% (-2)
- Probably won't vote: 2% (-1)
CONGRESS (among registered voters):
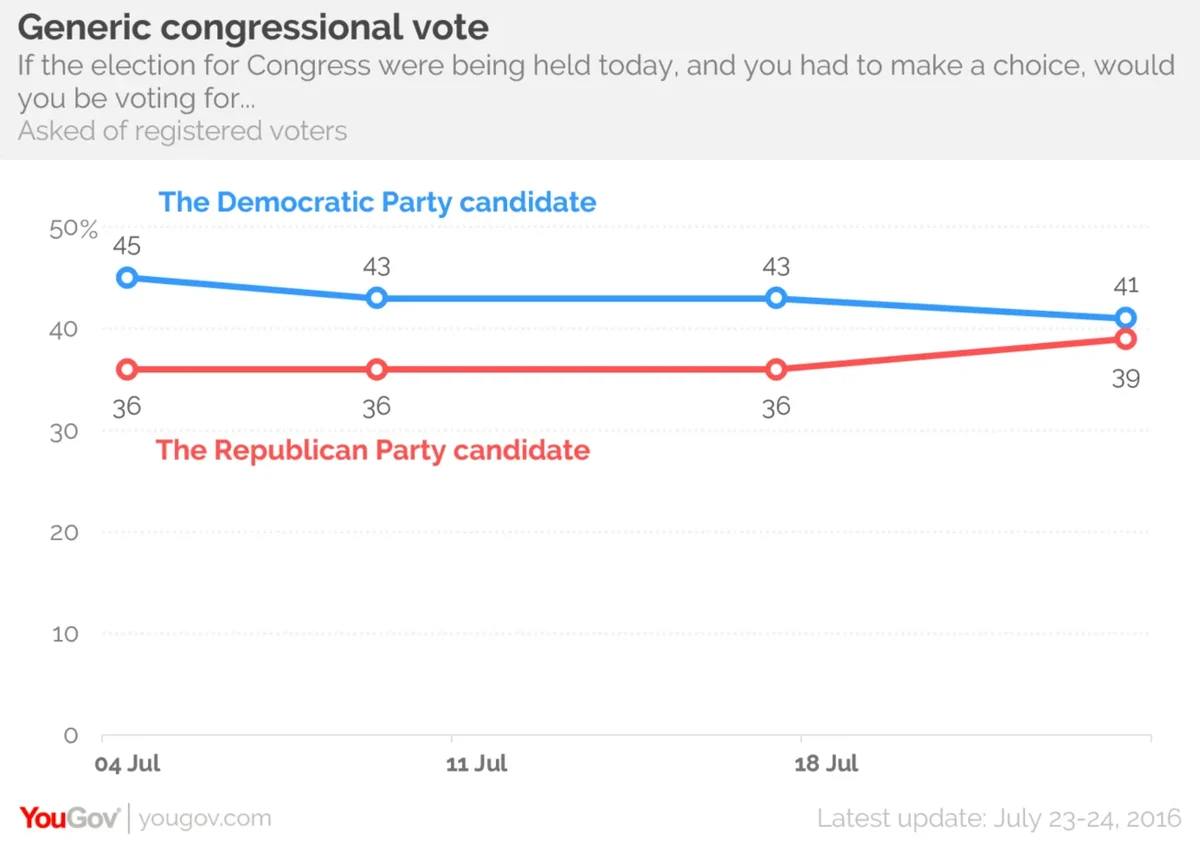
If the election for Congress were being held today, and you had to make a choice, would you be voting for...
- The Democratic Party candidate: 43% (0)
- The Republican Party candidate: 36% (0)
- Other: 3% (0)
- Not sure: 14% (0)
- I would not vote: 4% (0)
Approval of Obama as president (among all adults):
- Approve: 47% (+1)
- Disapprove: 48% (+2)
Among registered voters, 48% approve of Obama and 49% disapprove.
Approval of Congress:
- Approve: 11% (0)
- Disapprove: 58% (-4)
Direction of the country:
- Right direction: 24% (+1)
- Disapprove: 67% (+2)
Other highlights:
Presidential election
- A wider gap has opened up between the share who "might consider" voting for Clinton (52%) compared to those who would consider voting for Trump (44%)
- Clinton is also seen to have a well managed campaign by 57%, versus 52% who say Trump's is poorly run
- However, on the issues of terrorism and the economy, similar proportions have confidence in Trump and Clinton
- Americans are more likely to describe Clinton as "capable" (51% for Clinton to 42% for Trump), but also as "corrupt" (55% for Clinton to 45% for Trump)
Republican National Convention
- 74% of Americans at least read or watched news about the RNC
- By 43% to 38% these respondents said it was "well managed" rather than "poorly run"
- by 46% to 20% audiences say more time was spent attacking Hillary Clinton than explaining what Donald Trump would do as president
- 37% in this group were bothered "a lot" that parts of Melania Trump's speech were taken from Michelle Obama's speech in 2008. Another 21% were bothered a little.
- American's approve of Ted Cruz's speech telling people to "vote your conscience" by 52% approve to 40% disapprove
- 42% said Trump's convention speech was "excellent" or "good", while 37% said it was only "fair" or "poor".
- Among the general public, the balance of opinion has improved slightly for Tim Kaine before and after his selection as VP was announced. Before, 20% had a favorable impression, and 19% had a negative one, while 61% said "don't know". Now, the figures are 27% favorable, 20% unfavorable, and 53% Don't know.
- By 34% to 14% Americans are more likely to say he is a "good choice" rather than a "bad choice" for VP. For Mike Pence last week the split was 35% to 21% good/bad choice.
Additional questions and detailed demographic breakdowns: PDF
Topline summary: PDF
National Tracking Report: PDF
Presidential Election Tracking Report: PDF